1. Introduction
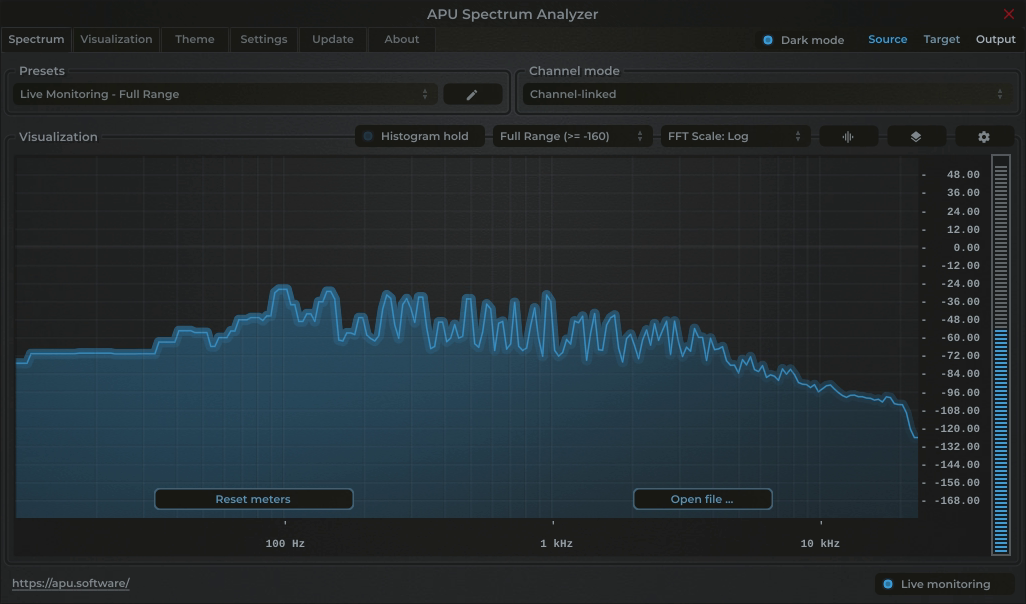
APU Spectrum Analyzer is a spectral analyzer plug-in released by APU Software, LLC. Here you can read about the different features and parameters available with the plug-in.
2. Parameters
This software supports a variety of parameters, most of which can be adjusted in real-time. This section provides an overview of each parameter, with each subsection detailing the parameters for the associated tab in the user interface. From within the user interface, you can also hover the mouse over a slider, combo-box, or checkbox to see a popup description of the parameter.
2.1. Spectrum
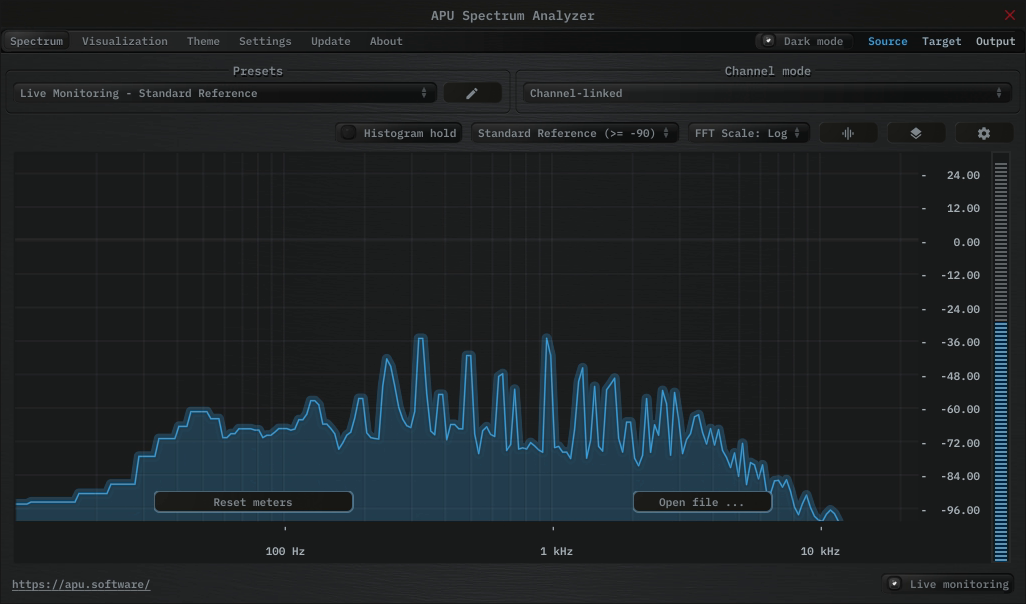
The spectrum tab contains configuration and visualization for spectral analysis. This section details each of the individual parameters and components.
2.1.1. Presets
Spectrum Analyzer’s presets combo-box contains a collection of basic presets.
The preset browser includes user-scope load options for ordinary preset changes. Reset on preset load runs a filtered parameter reset before the preset is applied. Load preset visuals controls whether the preset can change the hinted theme and visualization settings. Full Reset always restores all default parameter values, regardless of these options. You can switch between loading dark or light themes through the dark mode parameter.
Currently, the following presets are available (“Full Reset” restores all default parameter values):
- Full Reset
- Live Monitoring - Standard Reference
- Live Monitoring - Deep Range
- Live Monitoring - Full Range
- Live Monitoring - Auto Range
- Full Histogram - Standard Reference
- Full Histogram - Deep Range
- Full Histogram - Full Range
- Full Histogram - Auto Range
- Visualization - Spectrum (Spiral)
- Visualization - Spectrum (Swirl)
- Visualization - Spectrum (Polar)
- Visualization - Spectrum (Wave)
2.1.2. Channel mode
The channel mode parameter determines which channel the visualizer shows. Channel-linked shows the average of all channels, while channel-select shows only the selected channel.
2.1.3. Visualization
The visualization component displays a continuously evolving real-time view of your source spectrum over time.
You can hover the mouse over a bucket to see the frequency range and loudness the bucket corresponds to.
Detailed visualization settings can be adjusted from the visualization tab, with some features also available by right clicking on the visualization component.
You can double-click the visualization component to resize and hide everything else.
2.1.4. FFT scale type
The FFT scale type parameter determines the frequency scale used for the visualization. The following options are available:
- Linear: Linear frequency scale with frequency labels
- Log: Logarithmic frequency scale with frequency labels
- Note: Logarithmic frequency scale with note labels
2.1.5. FFT window type
The FFT window type parameter determines the window type used for the spectral histogram’s FFT. The following options are available:
- Rect: Rectangular window
- Hann: Hann window
- Hamming: Hamming window
- Blackman: Blackman window
- Kaiser: Kaiser window
When using the Kaiser window, the Kaiser beta parameter is used to determine the window shape.
2.1.6. FFT window size
The FFT window size parameter determines the size of the spectral histogram’s FFT window.
The FFT window size determines a trade-off between frequency resolution and time resolution. A larger window size provides better frequency resolution, while a smaller window size provides better time resolution.
2.1.7. Kaiser beta
The Kaiser beta parameter determines the shape of the window when Kaiser FFT window type is selected.
2.1.8. Raster type
The raster type parameter allows you to enable/disable the spectral histogram raster visualization.
2.1.9. Raster orientation
The raster orientation parameter allows you to specify the rotation of the raster visualization. You can select between horizontal and vertical orientations.
2.1.10. Sidechain
The sidechain toggle allows you to enable/disable sidechain processing. When enabled, the target signal will come from the plug-in’s sidechain channel(s). This allows you to monitor an external source, which can be used for example to compare the sidechain signal to the source signal.
2.1.11. Live monitoring
The live monitoring option enables continuous spectral analysis and visualization. When disabled, only arrangement/timeline playback will be monitored. This can help ensure the accuracy of spectral measurements.
2.1.12. Reset on play
In plug-in formats, the reset on play option resets spectral analysis and visualization history as if the reset button was pressed when host transport changes from stopped or paused to playing.
2.1.13. Reset meters
The reset button resets the spectral histogram.
2.1.14. Open file
The “Open file …” button allows you to perform analysis on any supported audio file. This will also clear all previous histogram visualizations.
This feature automatically switches to histogram view after analyzing the file, which allows you to quickly view the spectrum of the audio material.
After opening an audio file, press the “Close file” button to return to live monitoring.
2.2. Visualization
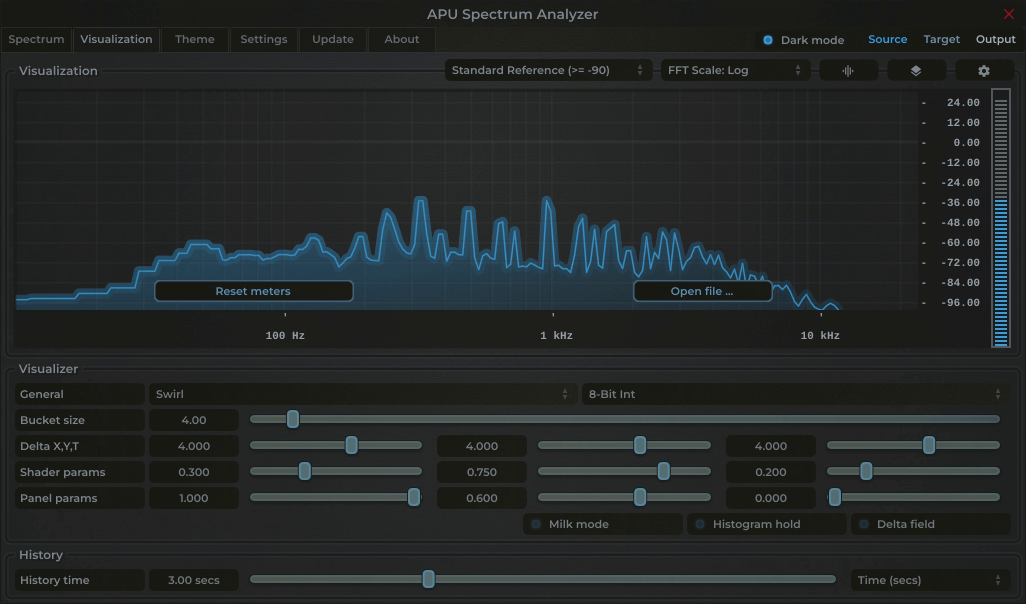
The visualization tab contains parameters related to real-time configuration of Spectrum Analyzer’s visualizations. This section describes these various settings.
2.2.1. Auto range
The auto range parameter enables or disables the visualization’s auto range finding capabilities. This feature operates by analyzing the continuous histogram at each frame to determine a reasonable range for that moment in time. This range is then followed and adjusted smoothly over time.
2.2.2. Visual range presets
Visual range presets are provided for convenience to quickly adjust the dB range of the visualizer.
Currently, the following visual range presets are available:
- Auto Range (Global)
- Auto Range (Per Panel)
- Standard Reference (>= -90)
- Deep Range (>= -120)
- Full Range (>= -160)
- Custom Range …
2.2.3. Loudness range
The loudness range parameter allows the visualization loudness range to be set manually. In order for this range to be enabled and used, the visual range presets parameter must be set to “Custom Range”
See range sliders for information about range sliders in general.
2.2.4. Snapshots
The snapshots feature allows you to take a snapshot of the current histogram. This can be useful for comparing histograms.
Each source/target/output signal has its own snapshot. The snapshots are persisted with plug-in state, so they will be available when you reopen the project.
Snapshots can be operated using the popup menu or via keyboard shortcuts.
The following snapshot parameters are available:
- Save/clear snapshot (saves or clears the current histogram)
- Source = Cmd + 1
- Target = Cmd + 2
- Output = Cmd + 3
- Fill snapshot (fills the area under the snapshot)
- Source = Cmd + Alt + 1
- Target = Cmd + Alt + 2
- Output = Cmd + Alt + 3
- Show/hide snapshot (shows or hides the snapshot in the visualization)
- Source = Cmd + Shift + 1
- Target = Cmd + Shift + 2
- Output = Cmd + Shift + 3
On Windows, use Ctrl instead of Cmd.
2.2.5. Layout options
The options menu allows you to configure the layout of the visualization. The following options are available:
- layout source mode : Specifies the layout mode for the source signal.
- layout target mode : Specifies the layout mode for the target signal.
- layout output mode : Specifies the layout mode for the output signal.
- raster type : Specifies the type of raster visualization.
- raster orientation : Specifies the orientation of the raster visualization.
- show peak meter : Specifies whether or not to show peak meter.
- show spectrum peak : Specifies whether or not to show spectral peak.
- show axis labels : Specifies whether or not to show loudness axis labels.
- show axis lines : Specifies whether or not to show loudness axis lines.
- show alt axis labels : Specifies whether or not to show frequency axis labels.
- show alt axis lines : Specifies whether or not to show frequency axis lines.
Each layout mode has an AUTO option which automatically selects the best layout mode based on the current context.
2.2.6. Layout source mode
The layout source mode parameter allows you to configure the layout of the visualization’s source panel.
Currently, the following layout source modes are available:
- None (No source panel is displayed)
- Auto (Automatically selects the best layout mode based on the current context)
- Source only (Draws just the source signal)
- Source over Target (Draws the target signal first, then the source signal on top)
- Source over Output (Draws the output signal first, then the source signal on top)
2.2.7. Layout target mode
The layout target mode parameter allows you to configure the layout of the visualization’s target panel.
Currently, the following layout target modes are available:
- None (No target panel is displayed)
- Auto (Automatically selects the best layout mode based on the current context)
- Target only (Draws just the target signal)
- Target over Source (Draws the source signal first, then the target signal on top)
- Target over Output (Draws the output signal first, then the target signal on top)
2.2.8. Layout output mode
The layout output mode parameter allows you to configure the layout of the visualization’s output panel.
Currently, the following layout output modes are available:
- None (No output panel is displayed)
- Auto (Automatically selects the best layout mode based on the current context)
- Output only (Draws just the output signal)
- Output over Source (Draws the source signal first, then the output signal on top)
- Output over Target (Draws the target signal first, then the output signal on top)
2.2.9. Delta field type
The delta field type parameter allows you to specify the type of delta field used by the visualization.
The delta field is basically a mapping from each source pixel on the screen to a destination pixel. Pixel shaders are used to iteratively apply this delta field using interpolation and some light dithering effects. This feature is purely for aesthetic purposes and has no effect on the audio.
Raster type effects are drawn into the delta field on each frame.
2.2.10. Bits per pixel
The bits-per-pixel parameter determines the number of bits per pixel to use when rendering visualizations. The default bpp is the best performing. You can increase bpp to improve visual quality.
2.2.11. Milk Mode
The “Milk mode” parameter enables/disables milk mode. In milk mode, the visualizations will look smoother and behave more like a screensaver at the expense of accuracy. This feature is purely for entertainment purposes.
2.2.12. Bar Mode
The “Bar mode” parameter enables/disables bar mode. In bar mode, the visualizations will be drawn as vertical bars instead of sloped lines. This feature is purely for aesthetic purposes and has no effect on the audio.
2.2.13. Bucket size
The bucket size parameter determines the size in pixels of visualization buckets (rectangles).
2.2.14. Histogram hold
The histogram hold parameter enables or disables “hold” mode for the histogram raster types. While “hold” mode is enabled, the histogram will continuously accumulate measurements indefinitely. This can be used to capture a full duration view of your source audio. This allows you to easily adjust ranges to target to a specific region of the full dynamic range.
The histogram will still continuously accumulate measurements while “hold” mode is disabled, but for each new measurement the oldest measurement in history is replaced. This results in a continuously evolving histogram of duration specified by the history length parameter.
2.2.15. Delta X/Y/T
The delta X/Y/T parameters are provided to the visualization delta field in order to manipulate the delta field in real-time. The exact behavior of each parameter depends on the active delta field type.
2.2.16. Delta field
The delta field parameter allows you to enable or disable the visualization delta field.
The delta field is basically a mapping from each source pixel on the screen to a destination pixel. Pixel shaders are used to iteratively apply this delta field using interpolation and some light dithering effects. This feature is purely for aesthetic purposes and has no effect on the audio.
Raster type effects are drawn into the delta field on each frame.
2.2.17. Shader params
The shader parameters control various aspects of visualization rendering. The following options are available:
- Shader param 1: Delta field fade rate. Lower values leave longer trails.
- Shader param 2: Curve fill transparency. Lower values make the curve more transparent, leaving only the edge(s) visible.
- Shader param 3: Curve edge thickness. Lower values make the edge thinner.
2.2.18. Show contour
The show contour parameter allows you to enable or disable contour drawing in the visualization.
Show contour applies to all panels in the visualization, including source, target, and output signals.
2.2.19. Panel params
The panel parameters control various aspects of panel rendering. The following options are available:
- Panel param 1: Panel alpha (transparency), 0.0 to remove panel completely
- Panel param 2: Panel hue (rotates through normal, source, target, output).
- Panel param 3: Panel hue intensity
2.2.20. History length
The history length parameter allows you to change the duration of spectral history accumulated by the histogram. Each new spectrum sample contributes to the histogram while the oldest samples age out, maintaining the duration you’ve configured here.
During histogram hold the histogram has an effectively infinite history length.
2.2.21. Show peak meter
The show peak meter parameter allows you to enable or disable peak meter drawing next to the visualizer.
2.2.22. Show spectrum peak
The show spectrum peak parameter allows you to enable or disable spectral peak drawing.
2.2.23. Show axis labels
The show axis labels parameter allows you to enable or disable axis drawing in the visualization.
The axis is scaled relative to the loudness range, which can be manual or auto range.
2.2.24. Show axis lines
The show axis lines parameter allows you to enable or disable axis line drawing in the visualization.
axis lines are drawn at each Show axis labels.
2.2.25. Show alt axis labels
The show axis labels parameter allows you to enable or disable frequency axis drawing in the visualization.
2.2.26. Show alt axis lines
The show axis lines parameter allows you to enable or disable frequency axis line drawing in the visualization.
axis lines are drawn at each Show alt axis labels.
2.3. Theme
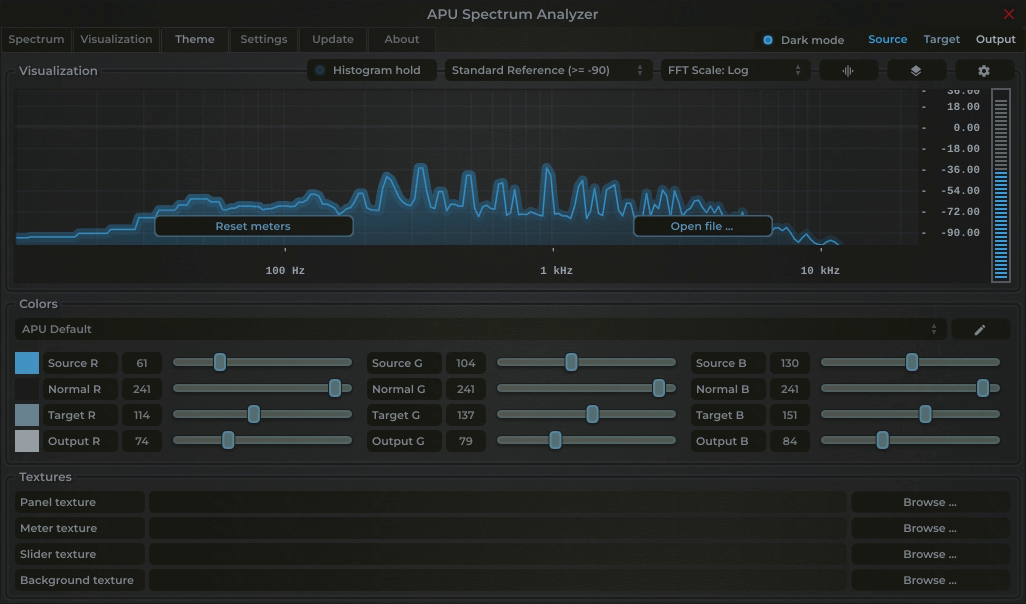
The theme tab contains parameters related to color themes. Here you can select between the bank of color theme presets, or configure the individual colors yourself.
2.3.1. Theme presets
The theme presets combo-box allows you to switch between a variety of theme presets. Each theme has a light and dark variation. Switching between theme presets will load values into source color, normal color, target color and output color.
Currently, the following themes are available:
- APU Default
- APU Red
- APU Vermilion
- APU Orange
- APU Amber
- APU Yellow
- APU Lime
- APU Chartreuse
- APU Harlequin
- APU Green
- APU Erin
- APU Spring
- APU Aquamarine
- APU Cyan
- APU Turquoise
- APU Azure
- APU Cerulean
- APU Blue
- APU Indigo
- APU Violet
- APU Purple
- APU Magenta
- APU Raspberry
- APU Rose
- APU Crimson
2.3.2. Source color
The source color parameters control the red, green, and blue components of the source color.
The source color is used in a variety of contexts, from interactive widgets to visualization elements. This color signifies that an element relates to the source signal in some way. This color is expected to contrast against the normal color to some extent.
2.3.3. Normal color
The normal color parameters control the red, green, and blue components of the “normal” color.
The normal color is used in a variety of contexts, from interactive widgets to visualization elements. This color signifies that an element is essentially neutral, not related to source, target or output signal. This color is expected to contrast against the source color, target color, and output color to some degree.
2.3.4. Target color
The target color parameters control the red, green, and blue components of the target color.
The target color is used in a variety of contexts, from interactive widgets to visualization elements. This color signifies that an element relates to the target signal in some way. This color is expected to contrast against the normal color to some extent.
2.3.5. Output color
The output color parameters control the red, green, and blue components of the output color.
The output color is used in a variety of contexts, from interactive widgets to visualization elements. This color signifies that an element relates to the output signal in some way. This color is expected to contrast against the normal color to some extent.
2.3.6. Textures
The textures configuration allows you to change the user interface textures.
The panel texture is used for the background of the user interface and has the shader params applied. The meter texture is used to fill the visualization effects. The background texture is used throughout the plug-in for shading.
These settings are stored with user scope, so you don’t need to change them with every instance. Closing a texture will reverted to the default internal texture.
Typically, the panel texture should be very dark and the meter texture should be very light.
2.4. Settings
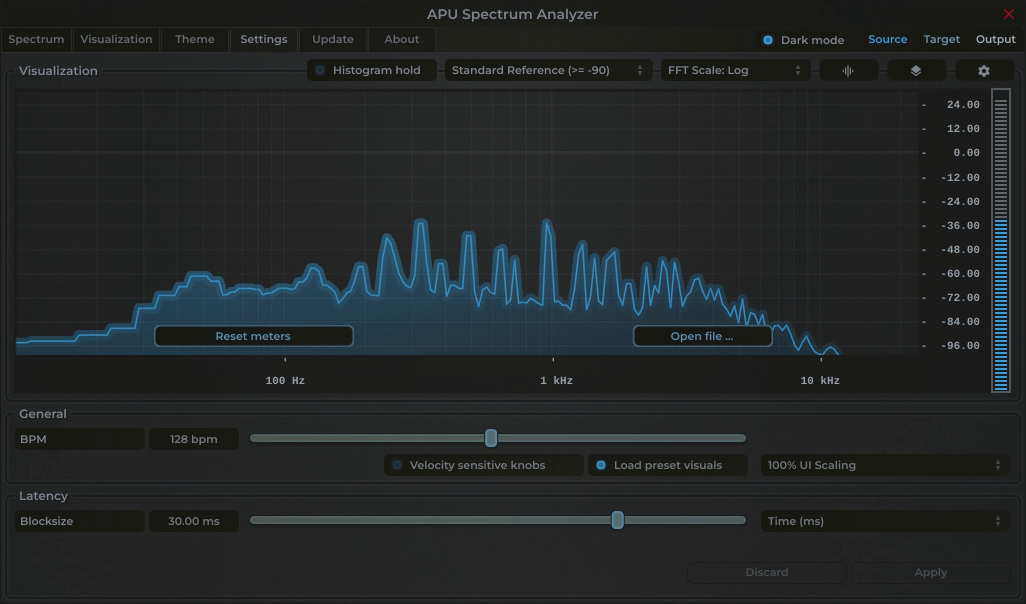
The settings tab contains various additional parameters. These parameters are broken down between General and Latency parameters. Since Latency parameters impact delay compensation, changes to these parameters are deferred until you click the Apply button. It is generally not advisable to automate the parameters in the Latency section.
2.4.1. BPM
The bpm option allows you to set the BPM used by tempo-relative parameters.
2.4.2. Host BPM
The host bpm option enables usage of the host’s BPM for tempo-relative parameters. When disabled, the bpm parameter is used instead.
This parameter is not available (nor applicable) to the standalone application.
2.4.3. Velocity sensitive knobs
If enabled, this will turn on velocity-sensitive dragging, so that the faster the mouse moves, the bigger the movement to the knobs. This helps when making accurate small-scale adjustments.
This parameter is saved at user scope, so it will be remembered between sessions.
2.4.4. UI Scaling
The UI scaling option allows you to set the scaling of the user interface. This is useful for high-DPI displays, where the default scaling may be too small to read comfortably.
This parameter is saved at user scope, so it will be remembered between sessions.
2.4.5. Axis Scaling
The axis scaling option allows you to set the scaling of the axis ticks, labels and text bubbles. This is useful for high-DPI displays, where the default scaling may be too small to read comfortably.
This parameter is saved at user scope, so it will be remembered between sessions.
2.4.6. Dark mode
The dark mode toggle enables/disables dark mode. When enabled, theme colors have their brightness inverted.
2.4.7. Blocksize
The block size parameter determines the time frequency of FFT filtering. Generally speaking, lower block sizes will give more accurate results. However, lower block sizes also require more CPU resources, so it is necessary to find a balance. You can squeeze improved quality and/or performance by tuning this setting based on your available CPU resources.
BPM units for block size are evaluated once at the time you press Apply.
2.4.8. Delay compensation
The delay compensation parameter determines whether or not the plug-in will report latency to the host. Delay compensation is used by hosts to keep audio synchronized across channels.
The delay compensation option is not available (nor applicable) to the standalone application.
2.5. Update
The update tab allows you to check for the latest product versions. Just click “Check for updates” to see the latest version numbers. If you’re not running the latest version, you can click “Download” to open the download page in your default browser.
2.6. About
The about tab contains basic information about the plug-in. This is also where you can activate or deactivate your product keys and check license status.
3. Standalone CLI
APU Spectrum Analyzer’s standalone application exposes a small user-facing command-line interface for loading, saving, and resetting standalone preset files. This section documents the supported options only.
Supported options:
--helpprints the supported standalone CLI options and exits.--resetParamsresets parameters after the standalone app loads its remembered state.--loadPreset="<path>"loads a preset file before the window is shown.--savePreset="<path>"writes the resulting preset file and exits without opening the user interface.
Processing order:
- The standalone app first loads its normal remembered standalone state.
- If
--resetParamsis present, a full parameter reset is applied. - If
--loadPresetis present, that preset file is loaded next. - If
--savePresetis present, the resulting state is written to disk and the app exits immediately.
Examples:
<standalone-app> --help<standalone-app> --savePreset="C:\Temp\spectrum-startup.preset"<standalone-app> --resetParams --savePreset="C:\Temp\spectrum-reset.preset"<standalone-app> --loadPreset="/tmp/spectrum-session.preset"<standalone-app> --loadPreset="/tmp/spectrum-session.preset" --savePreset="/tmp/spectrum-copy.preset"
Compatibility:
--loadPresetand--savePresetuse the same file format as the standalone app’s standard JUCE options-button commands,Save current state...andLoad a saved state....- These file-based presets store the full standalone processor state. They are different from the in-app presets combo-box, which loads the product’s built-in preset entries and user preset-list selections.
4. Glossary
This section defines some of the concepts used within the software.
4.1. Range sliders
Range sliders are used throughout the plug-in in order to specify the upper and lower boundaries of a range. These ranges can be controlled via mouse in various ways.
- Click and drag the lower thumb to adjust the minimum value.
- Click and drag the upper thumb to adjust the maximum value.
- Click and drag the region between slider thumbs to move both values. This allows you to adjust the average loudness without expanding/contracting the dynamic range.
- Ctrl + click and drag the region between slider thumbs to expand/contract range without changing the average (center) value. Drag the mouse up and down, left and right are ignored.
- Shift + click and drag the region between slider thumbs to combine both. Drag the mouse up and down to expand/contract range. Drag the mouse left and right to move both values.
4.2. Histogram
One of the primary views into your audio that this software provides is a real-time histogram. Histograms in general provide a quick and intuitive way to understand the relative frequency of different measurements. This is very useful when judging the overall dynamic range of the audio. The histogram provided by this software is capable of changing history length, bucket size and size continuously.
4.3. Source
The term “source” is used throughout the plug-in to identify the plug-in’s input source signal. This signal is represented in the user interface by the current theme’s source color.
4.4. Target
The term “target” is used throughout the plug-in to identify the configured target range loudness. This signal is represented in the user interface by the current theme’s target color.
4.5. Output
The term “output” is used throughout the plug-in to identify output-related visualization and theme elements. These elements are represented in the user interface by the current theme’s output color.
5. Credits
This software was developed by APU Software, LLC and is available as VST (windows x64/x86, macOS universal), Audio Unit (macOS universal), Pro Tools AAX (windows x64, macOS universal), or Standalone Application (windows x64/x86, macOS universal). The software libraries below are utilized for portions of the software:
- JUCE (cross-platform audio and user interface framework)
- Boost (header-only algorithms)
- melatonin_blur (blur effects)
- PFFFT (FFT library)
Demo video song credits:
- Annasara - A Lifetime Rolls By, licensed via Audiio


5.1. MIT License (libebur128)
Copyright (c) 2011 Jan Kokemüller
Permission is hereby granted, free of charge, to any person obtaining a copy
of this software and associated documentation files (the "Software"), to deal
in the Software without restriction, including without limitation the rights
to use, copy, modify, merge, publish, distribute, sublicense, and/or sell
copies of the Software, and to permit persons to whom the Software is
furnished to do so, subject to the following conditions:

The above copyright notice and this permission notice shall be included in
all copies or substantial portions of the Software.

THE SOFTWARE IS PROVIDED "AS IS", WITHOUT WARRANTY OF ANY KIND, EXPRESS OR
IMPLIED, INCLUDING BUT NOT LIMITED TO THE WARRANTIES OF MERCHANTABILITY,
FITNESS FOR A PARTICULAR PURPOSE AND NONINFRINGEMENT. IN NO EVENT SHALL THE
AUTHORS OR COPYRIGHT HOLDERS BE LIABLE FOR ANY CLAIM, DAMAGES OR OTHER
LIABILITY, WHETHER IN AN ACTION OF CONTRACT, TORT OR OTHERWISE, ARISING FROM,
OUT OF OR IN CONNECTION WITH THE SOFTWARE OR THE USE OR OTHER DEALINGS IN
THE SOFTWARE.
5.2. MIT License (melatonin_blur)
Copyright (c) 2023 Sudara Williams
Permission is hereby granted, free of charge, to any person obtaining a copy
of this software and associated documentation files (the "Software"), to deal
in the Software without restriction, including without limitation the rights
to use, copy, modify, merge, publish, distribute, sublicense, and/or sell
copies of the Software, and to permit persons to whom the Software is
furnished to do so, subject to the following conditions:

The above copyright notice and this permission notice shall be included in all
copies or substantial portions of the Software.

THE SOFTWARE IS PROVIDED "AS IS", WITHOUT WARRANTY OF ANY KIND, EXPRESS OR
IMPLIED, INCLUDING BUT NOT LIMITED TO THE WARRANTIES OF MERCHANTABILITY,
FITNESS FOR A PARTICULAR PURPOSE AND NONINFRINGEMENT. IN NO EVENT SHALL THE
AUTHORS OR COPYRIGHT HOLDERS BE LIABLE FOR ANY CLAIM, DAMAGES OR OTHER
LIABILITY, WHETHER IN AN ACTION OF CONTRACT, TORT OR OTHERWISE, ARISING FROM,
OUT OF OR IN CONNECTION WITH THE SOFTWARE OR THE USE OR OTHER DEALINGS IN THE
SOFTWARE.
5.3. FFTPACK License (pffft)
Copyright (c) 2013  Julien Pommier ( pommier@modartt.com )
Based on original fortran 77 code from FFTPACKv4 from NETLIB,
authored by Dr Paul Swarztrauber of NCAR, in 1985.
As confirmed by the NCAR fftpack software curators, the following
FFTPACKv5 license applies to FFTPACKv4 sources. My changes are
released under the same terms.
FFTPACK license:
http://www.cisl.ucar.edu/css/software/fftpack5/ftpk.html
Copyright (c) 2004 the University Corporation for Atmospheric
Research ("UCAR"). All rights reserved. Developed by NCAR's
Computational and Information Systems Laboratory, UCAR,
www.cisl.ucar.edu.
Redistribution and use of the Software in source and binary forms,
with or without modification, is permitted provided that the
following conditions are met:
- Neither the names of NCAR's Computational and Information Systems
Laboratory, the University Corporation for Atmospheric Research,
nor the names of its sponsors or contributors may be used to
endorse or promote products derived from this Software without
specific prior written permission.
- Redistributions of source code must retain the above copyright
notices, this list of conditions, and the disclaimer below.
- Redistributions in binary form must reproduce the above copyright
notice, this list of conditions, and the disclaimer below in the
documentation and/or other materials provided with the
distribution.
THIS SOFTWARE IS PROVIDED "AS IS", WITHOUT WARRANTY OF ANY KIND,
EXPRESS OR IMPLIED, INCLUDING, BUT NOT LIMITED TO THE WARRANTIES OF
MERCHANTABILITY, FITNESS FOR A PARTICULAR PURPOSE AND
NONINFRINGEMENT. IN NO EVENT SHALL THE CONTRIBUTORS OR COPYRIGHT
HOLDERS BE LIABLE FOR ANY CLAIM, INDIRECT, INCIDENTAL, SPECIAL,
EXEMPLARY, OR CONSEQUENTIAL DAMAGES OR OTHER LIABILITY, WHETHER IN AN
ACTION OF CONTRACT, TORT OR OTHERWISE, ARISING FROM, OUT OF OR IN
CONNECTION WITH THE SOFTWARE OR THE USE OR OTHER DEALINGS WITH THE
SOFTWARE.